Using 100 years daily records of the Sun at the Kodaikanal Solar Observatory, astronomers have succeeded in mapping, for the very first time, the variation in the rotation speed of the Sun’s chromosphere, from the equator right up to its polar regions. The research can help give a complete picture of the Sun’s inner workings.
Earth spins like a rigid ball, completing a full rotation every 24 hours. This rotation is the same everywhere on Earth, from bustling Bangalore to the icy plains of Antarctica. The Sun, however, has a completely different story to tell. Being a giant ball of plasma, different parts of the Sun rotate at different speeds, depending on their latitude. It has been known for a long time that the Sun’s equator spins much faster than its poles. It takes the equatorial region only about 25 days to complete one rotation, while the poles take a leisurely 35 days. This difference in rotation speed is called differential rotation. Understanding the intricacies of the variation in rotation speed, as a function of latitude as well as time, is crucial to understand the Sun itself. This is because the interaction of differential rotation with the Sun’s magnetic field is what is behind the solar dynamo, the 11-year solar cycle, and its periods of intense activity that even produce magnetic storms on Earth.
The discovery of differential rotation dates back to Carrington in the 19th century, who observed that sunspots on the visible surface of the Sun rotated at different speeds depending on their latitude. However, sunspots do not appear at latitudes higher than about 35 degrees north or south of the solar equator, and other methods had to be used to measure differential rotation closer to the polar latitudes. These either relied on spectrographs which are not easy to use for this particular purpose, or had to wait for those rare sunspots that occurred occasionally at higher latitudes. These methods are unsuited to confirm reports how the differential rotation itself varies with time over a solar cycle, etc.
Astronomers from the Indian Institute of Astrophysics (IIA), an autonomous institute of DST, used solar plages and networks from daily records of the Sun stretching over 100 years, maintained by the Kodaikanal Solar Observatory, operated by the Indian Institute of Astrophysics. The observatory celebrates its 125th anniversary this year.
“The Kodaikanal Solar Observatory is just one of two such places in the entire world with such long-term data”, said Muthu Priyal, a co-author of the study, working at IIA. “We hit on the idea of using solar plages and networks to measure rotation speeds. Images captured at the specific wavelength of 393.3 nanometers (due to the Calcium K spectral line) showcase the lower and middle chromosphere and display prominent features like plages (bright regions) and network cells (convective structures)”, she added.
Plages, unlike sunspots, are brighter regions with weaker magnetic fields. They reside in the chromosphere, and are significantly larger than sunspots, ranging from 3 to 10 times the size of sunspots. Network features, on the other hand, are embedded with weaker magnetic fields and are about 30,000 km across – slightly larger than individual sunspots but smaller than sunspot groups. Unlike sunspots, both plages and networks are continuously present across the Sun’s surface throughout the solar cycle, allowing the scientists to probe the rotation rate even at the poles.
The Observatory had meticulously documented the chromosphere using photographic plates and films and this invaluable data has recently been digitized using a large-format CCD camera, making it accessible to researchers worldwide. “We decided to use this treasure trove of information and meticulously extracted data on plages and network features from the images. These features were then categorized based on their location within 10-degree latitude bands across both the Sun’s northern and southern hemispheres”, said Prof Jagdev Singh of IIA, and a co-author of the paper.
By analyzing this data, the team was able to extract the rotation period of these features at various latitudes. This revealed a clear picture of the Sun’s differential rotation – faster at the equator (13.98 degrees per day) and slower towards the poles (10.5 degrees per day at 80 degrees latitude). Intriguingly, both plages and network features displayed remarkably similar rotation rates. This suggests a potential shared origin of both plages and networks, possibly rooted deep within the Sun’s interior below the photosphere (the visible surface).
Said Prof. B. Ravindra of IIA, “This work signifies the first-time scientists have successfully utilized chromospheric network cells to map the Sun’s rotation from equator to pole. Understanding the Sun’s differential rotation is crucial for comprehending its magnetic field and activity. This research using chromospheric features paves the way for a more complete picture of the Sun’s inner workings”.
This paper was published in the Astrophysical Journal, titled “Equator to Pole Solar Chromospheric Differential Rotation Using Ca-K Features Derived from Kodaikanal Data”, and was authored by Kharayat, Hema (Indian Institute of Astrophysics and M.L.K.P.G. College, Balrampur) and Singh, Jagdev, Priyal, Muthu and Ravindra, B. from Indian Institute of Astrophysics.
Reference The Astrophysical Journal, 968:53 (9pp), 2024 June 20
Article link: https://automatedtest.iopscience.iop.org/article/10.3847/1538-4357/ad4992

Figure: This schematic illustrates the Sun’s differential rotation, where surface regions at various latitudes rotate at different speeds.
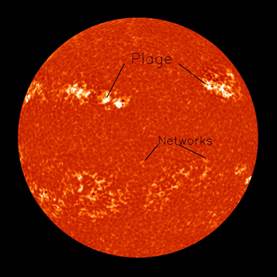
Figure: Calcium-K spectroheliogram of the Sun, captured at the Kodaikanal Solar Observatory on April 11, 1936. The image highlights the chromosphere, showcasing plages (bright regions) and networks (web-like features) associated with the Sun’s magnetic activity.

Figure: This figure depicts the Sun’s differential rotation, where different latitudes rotate at varying speeds. The data points (shown in different colors) represent rotation rates measured using features like plages and different types of network regions in the Sun’s chromosphere.
Comments are closed.