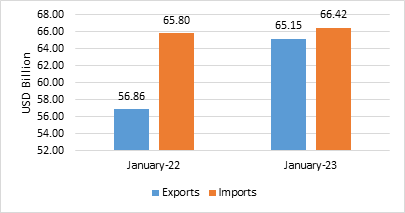
- India’s overall exports (Merchandise and Services combined) in January 2023* are estimated to be USD 65.15 Billion, exhibiting a positive growth of 14.58 per cent over the same period last year. Overall imports in January 2023* are estimated to be USD 66.42 Billion, exhibiting a positive growth of 0.94 per cent over the same period last year.
Table 1: Trade during January 2023*
| January 2023
(USD Billion) |
January 2022
(USD Billion) |
||
| Merchandise | Exports | 32.91 | 35.23 |
| Imports | 50.66 | 52.57 | |
| Services* | Exports | 32.24 | 21.63 |
| Imports | 15.76 | 13.24 | |
| Overall Trade
(Merchandise +Services) * |
Exports | 65.15 | 56.86 |
| Imports | 66.42 | 65.80 | |
| Trade Balance | -1.27 | -8.95 |
* Note: The latest data for services sector released by RBI is for December 2022. The data for January 2023 is an estimation, which will be revised based on RBI’s subsequent release. (ii) Data for April-January 2021-22 and April-September 2022 has been revised on pro-rata basis using quarterly balance of payments data.
Fig 1: Overall Trade during January 2023*
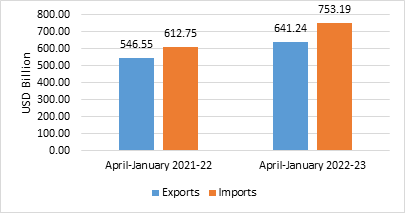
- India’s overall exports (Merchandise and Services combined) in April-January 2022-23 is estimated to exhibit a positive growth of 17.33 per cent over the same period last year (April-January 2021-22). As India’s domestic demand has remained steady amidst the global slump, overall imports in April-January 2022-23 is estimated to exhibit a growth of 22.92 per cent over the same period last year.
Table 2: Trade during April-January 2022-23*
| April-January 2022-23
(USD Billion) |
April-January 2021-22
(USD Billion) |
||
| Merchandise | Exports | 369.25 | 340.28 |
| Imports | 602.20 | 494.06 | |
| Services* | Exports | 272.00 | 206.28 |
| Imports | 150.99 | 118.69 | |
| Overall Trade (Merchandise+
Services) * |
Exports | 641.24 | 546.55 |
| Imports | 753.19 | 612.75 | |
| Trade Balance | -111.94 | -66.20 |
Fig 2: Overall Trade during April-January 2022-23*
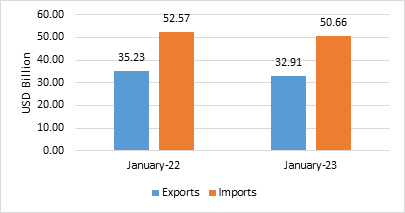
MERCHANDISE TRADE
- Merchandise exports in January 2023 were USD 32.91 Billion, as compared to USD 35.23 Billion in January 2022.
- Merchandise imports in January 2023 were USD 50.66 Billion, as compared to USD 52.57 Billion in January 2022.
Fig 3: Merchandise Trade during January 2023
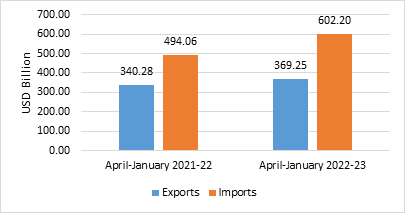
- Merchandise exports for the period April-January 2022-23 were USD 369.25 Billion as against USD 340.28 Billion during the period April-January 2021-22.
- Merchandise imports for the period April-January 2022-23 were USD 602.20 Billion as against USD 494.06 Billion during the period April-January 2021-22.
- The merchandise trade deficit for April-January 2022-23 was estimated at USD 232.95 Billion as against USD 153.79 Billion in April-January 2021-22.
Fig 4: Merchandise Trade during April-January 2022-23
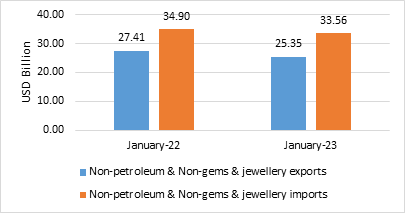
- Non-petroleum and non-gems & jewellery exports in January 2023 were USD 25.35 Billion, compared to USD 27.41 Billion in January 2022.
- Non-petroleum, non-gems & jewellery (gold, silver & precious metals) imports in January 2023 were USD 33.56 Billion, compared to USD 34.90 Billion in January 2022.
Table 3: Trade excluding Petroleum and Gems & Jewellery during January 2023
| January 2023
(USD Billion) |
January 2022
(USD Billion) |
|
| Non- petroleum exports | 27.97 | 30.65 |
| Non- petroleum imports | 35.98 | 40.21 |
| Non-petroleum & Non Gems & Jewellery exports | 25.35 | 27.41 |
| Non-petroleum & Non Gems & Jewellery imports | 33.56 | 34.90 |
Note: Gems &Jewellery Imports include Gold, Silver & Pearls, precious & Semi-precious stones
Fig 5: Trade excluding Petroleum and Gems & Jewellery during January 2023
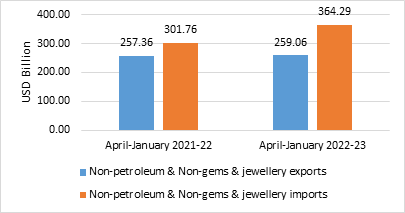
- Non-petroleum and non-gems & jewellery exports during April-January 2022-23 was USD 259.06 Billion, as compared to USD 257.36 Billion in April-January 2021-22.
- Non-petroleum, non-gems & jewellery (gold, silver & precious metals) imports were USD 364.29 Billion in April-January 2022-23 as compared to USD 301.76 Billion in April-January 2021-22.
Table 4: Trade excluding Petroleum and Gems & Jewellery during April-January 2022-23
| April-January 2022-23
(USD Billion) |
April-January 2021-22
(USD Billion) |
|
| Non- petroleum exports | 290.67 | 289.51 |
| Non- petroleum imports | 423.74 | 369.15 |
| Non-petroleum & Non Gems & Jewellery exports | 259.06 | 257.36 |
| Non-petroleum & Non Gems & Jewellery imports | 364.29 | 301.76 |
Note: Gems &Jewellery Imports include Gold, Silver & Pearls, precious & Semi-precious stones
Fig 6: Trade excluding Petroleum and Gems & Jewellery during April-January 2022-23
SERVICES TRADE
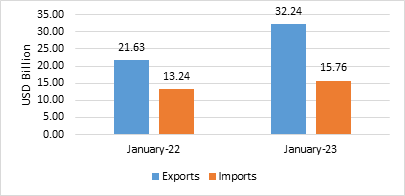
- The estimated value of services export for January 2023* is USD 32.24 Billion, as compared to USD 21.63 Billion in January 2022.
- The estimated value of services import for January 2023* is USD 15.76 Billion as compared to USD 13.24 Billion in January 2022.
Fig 7: Services Trade during January 2023*
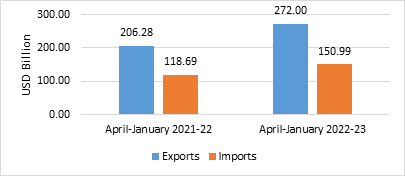
- The estimated value of services export for April-January 2022-23* is USD 272.00 Billion as compared to USD 206.28 Billion in April-January 2021-22.
- The estimated value of services imports for April-January 2022-23* is USD 150.99 Billion as compared to USD 118.69 Billion in April-January 2021-22.
- The services trade surplus for April-January 2022-23*is estimated at USD 121.01 Billion as against USD 87.58 Billion in April-January 2021-22.
Fig 8: Services Trade during April-January 2022-23*
- Global growth is projected to fall from an estimated 3.4 percent in 2022 to 2.9 percent in 2023, while India continues to shine as a bright spot with a growth of 6.8% in 2022 and 6.1% in 2023 with resilient domestic demand despite external headwinds. (IMF’s Jan 2023). This seems to be having a two-way effect on India’s trade. On one hand, it is reducing exports as there is decline in global growth resulting in sluggish export demand while on the other hand increasing imports as domestic demand remains resilient due to relatively high growth.
- Under merchandise exports, 14 of the 30 key sectors exhibited positive growth in January 2023 as compared to same period last year (January 2022). These include Electronic Goods (55.54%), Oil Meals (48.89%), Oil Seeds (23.81%), Iron Ore (21%), Rice (18.8%), Fruits & Vegetables (14.57%), Cashew (10.34%), Tobacco (9.41%), Ceramic Products & Glassware (8.25%), Petroleum Products (8.01%), Marine Products (6.61%), Other Cereals (3.92%), Spices (3.79%) and Tea (3.76%).
- Merchandise exports, 17 of the 30 key sectors exhibited positive growth during April-January 2022-23 as compared to the same period last financial year (April-January 2021-22). These include Petroleum products (54.78%), Electronic goods (51.96%), Tobacco (38.71%), Oil Meals (29.63%), Cereal Preparations & Miscellaneous Processed Items (17.36%), Rice (16.38%), Leather & Leather Products (13.92%), Oil Seeds (13.77%), Other Cereals (12.32%), Coffee (12.15%), Tea (11.62%), Fruits & Vegetables (10.28%), Ceramic Products & Glassware (7.23%), Organic & Inorganic Chemicals (5.56%), RMG of all Textiles (5.22%), Marine Products (3.06%) and Drugs & Pharmaceuticals (2.97%).
- All agricultural commodities exports barring coffee have shown positive growth in January 2023.
- Exports of Electronic goods increased by more than 50 percent during January 2023 at USD 2.11 Billion as compared to USD 1.36 Billion in January 2022. During April – January 2022-23 electronic goods exports were recorded at USD 18.78 Billion as compared to USD 12.36 Billion during the same period last year registering a growth of over 50 percent.
- Effect of duty withdrawal on Iron Ore is visible on India’s exports of the item which have exhibited positive growth of 21 percent during January 2023.
- Textiles, Plastic & Linoleum exports continued to decline in January 2023 because of subdued demand due to recessionary effects in major economies.
- Under merchandise imports, 17 out of 30 key sectors exhibited negative growth in January 2023. These include Silver (-82.05%), Gold (-70.76%), Sulphur & Unroasted Iron Pyrites (-64.44%), Pearls, Precious & Semi-Precious Stones (-29.65%), Cotton Raw & Waste (-19.49%), Electronic Goods (-18.55%), Metalliferous Ores & Other Minerals (-18.17%), Organic & Inorganic Chemicals (-15.56%), Non-Ferrous Metals (-14.34%), Dyeing/Tanning/Colouring Materials (-10.24%), Fruits & Vegetables (-7.55%), Medicinal & Pharmaceutical Products (-6.61%), Leather & Leather Products (-6.53%), Chemical Material & Products (-4.88%), Machinery, Electrical & Non-Electrical (-2.49%), Pulses (-1.58%) and Fertilisers, Crude & Manufactured (-1.1%).
- Merchandise import, 4 of the 30 key sectors exhibited negative growth in April-January 2022-23 as compared to the same period last financial year (April-January 2021-22). These include Gold (-27.91%), Sulphur & unroasted Iron Pyrites (-21.54%), Pulses (-17.20%) and Medicinal & Pharmaceutical Products (-11.48%).
- Gold imports, which have a bearing on the current account deficit, declined by 70.76 per cent to USD 0.70 Billion in January 2023 in comparison to USD 2.38 Billion in January 2022. Similarly, silver imports slumped by about 82% from USD 0.64 Billion in January 2022 to USD 0.11 Billion in January 2023.
- Merchandise exports growth for the period April-January 2022-23 remain impressive at 8.51% as against the same period last financial year (April-January 2021-22).
- In terms of export destinations, Netherlands emerged as 3rd largest export destination where exports have increased to USD 15.65 Billion with a share of 4.24% in April- January 2022-23 which is a jump in rank from 11th in 2017-18 and 5th in 2021-22. The exports to Saudi Arabia have increased to USD 8.86 Billion in April-January 2022-23 with a share of 2.40% which improved its rank from 12th in 2021-22 to 8th in April- January 2022-23. Brazil emerged at 9th spot in the current fiscal (April-January 2022-23) with a share of 2.30%, which is a jump in rank to 9th from 21st in 2021-22. Similarly, Indonesia has also emerged as top 11th exports destination with share of 2.18% in 2022-23 (April-January) from 14th in 2021-22. South Africa (15th with 1.96% share) and Israel (18th with 1.79% share) have also made their place in India’s top 20 exports destinations in 2022-23 (April – January).
- Services exports remain strong and projected to grow at 31.86 percent during April-January 2022-23 over same period last year (April-January 2021-22).
- Travel sector has shown significant recovery during April-September 2022 with growth of 180%. While IT/ITES and business services have maintained their robust growth, transportation and financial Services exports have grown at more than 35% during April-September 2022.
- In spite of strong global headwinds, with two months remaining in the current financial year, India’s overall exports is projected to grow at 17.33 percent during April-January 2022-23 over same period last year (April-January 2021-22).
Comments are closed.